Home> All PowerPoint Tutorials > PowerPoint Models > Wheel Diagram Template
Learn to create layered wheel consulting diagram in PowerPoint using Doughnut chart tool in Microsoft Excel. Follow our simple step by step instruction to draw the diagram.
The Wheel Diagram Template you’ll learn is:

The usual way to create wheel diagrams in PowerPoint is to use Block arc tool in auto shapes.

But the method is not only time consuming but also messy. In this article, you’ll learn a simple way to create the layered diagram using doughnut chart tool in Excel.
We have talked about this in creating Spoke diagram using SmartArt As well…
Step 1: Creating the base diagram
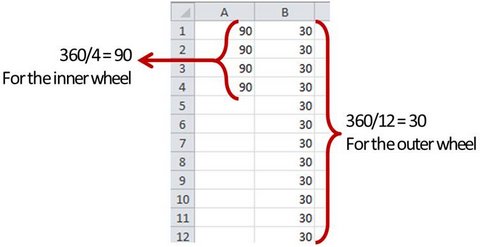
Open an Excel worksheet and enter the following values:

We want two layers for our wheel diagram. The inner wheel has 4 segments and the outer wheel has 12 segments.
The columns of values you enter in the worksheet go from inner to outer. Since we want 4 segments for the inner wheel, we divide the total number of angles in a circle i.e 360° by 4. We get 90°. We enter the values 4 times in the column. The same way we enter 30° values 12 times in the second column.
Now select the cells A1 to B12. Go to Insert -> Chart -> Other charts -> Doughnut.


You get the following basic wheel chart in the worksheet:
Click on the legend and delete so that you only have the wheels left.
Related: Creative Doughnut Chart Infographics Ideas
Step 2: Formatting the diagram
The next step is to reduce the size of doughnut hole. Select the inner wheel. Right click and go to Format Data Series. Under ‘Series options’ go to ‘Doughnut hole size’ tab. Move the slider and make the hole size as small as possible:

The result will be this colorful wheel diagram template:

Select the chart and go to Format tab in PowerPoint ribbon. Select relevant ‘Shape styles’ tool to format your diagram as follows:

The last step is to copy the chart and paste it on your PowerPoint slide. When you write relevant text for the segments, the diagrams gets finished as follows:

So, sometimes it helps to go beyond Microsoft PowerPoint to create your business diagrams.
Related: Tutorial to create a Spiral Model
Watch video tutorial to create 2-level Wheel diagram:
Variations of layered diagram in PowerPoint:
We wish to show you some interesting variations of layered wheel diagrams in PowerPoint taken from our ‘PowerPoint Charts and Diagram Templates Packs for CEOs’. The packs have more than 1600 Premium Charts, Diagrams, Graphs and Graphics to help you visualize your business ideas.
Source: PowerPoint Models from CEO Pack 2

The following diagram template has two sets of wheels connected by a cylinder:
Source: Pillar Diagrams from CEO Pack 1


It is not always easy to create professional looking business diagrams from the scratch. If you are a busy business presenter who doesn’t have the time to create your business graphics from the scratch, we have an elegant solution for you.
We recommend you take a look at our ‘PowerPoint 2 CEO Packs Bundle ’ . You just need to choose the template that matches your idea. Replace the sample text with your own text and your business slide gets ready in no time. Creating professional quality business presentations has never been easier.
Please browse through our diagrams collection and see how the CEO packs can change the way you create your business presentations forever.
Related: Easy Pillar Diagram Tutorial
Return to Main PowerPoint Models Page
Return to Top of Layered Wheel Diagram Template in PowerPoint Page
