Home > PowerPoint Slides > Visualization in Presentations
In this article, you’ll read about an important parameter for slide evaluation which is about visualization in presentations. Presenting your ideas and concepts visually increases clarity of your message for your audience.
Before we learn about the slide-o-meter parameter…
A quick word about the relationship between Assertion and Evidence:
In a PowerPoint slide, there is a clear place for assertion, evidence and explanation of the slide. Here is the pictorial representation of how assertion-evidence model works on slides:

Evidence is a combination of visual representation and verbal explanation.
For a presentation to be effective, the evidence needs to be easily understood. The best way to achieve this is by using visualization and build. We will talk about build in another article.
What is visualization?Visualization, as the word suggests is the art of representing information in visual form like diagrams, charts or images. The visuals are usually supported by narration from the presenter. |
Why use visualization in presentations?
To answer that, I want you to look at the following two slides. Both of them present the same information. Which of these two slides is easier for you to understand?
Slide 1: Text Based Slide on Sales Performance
Slide 2: Visual Slide with charts and Diagrams on Sales Performance

I am sure you chose the second slide.
Here are the two questions I want you to think about –
- What is the difference between the two slides in presenting the same information?
- What is the specific reason why the second slide is easier to understand?
Here is the difference:
The first slide provides data about sales performance. The second slide provides information about sales performance by capturing the relationship between the data.
Visualization is the art of capturing relationship between objects
Why capture relationship between objects?
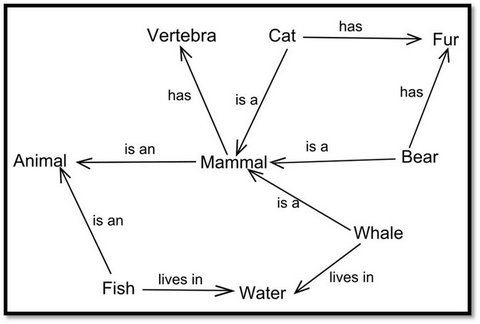
Human brain stores information by forming connection between objects. This web of connection is called ‘schema’. For example, the following may be the web of information in our mind about Mammals.

These connections help the brain to retrieve the stored information quickly, and learn new information by establishing the context easily.
When you use visualization in presentations, you help your audience connect your ideas and objects. This helps them ‘get’ your message and retain your information for a long time.
At this point, we wish to recommend our Visual Presentations eBook, which teaches you a simple yet remarkable process to convey your ideas as visual diagrams. It is a must have book, if you are serious about improving your business presentation skills.
Resouce: FREE DOWNLOAD: As a thank you for going through today’s article, you can download the first 3 chapters from the ‘Visual Presentations – eBook’ for free.
A primer on capturing relationship between objects:
While this short article doesn’t give us enough space to explain the detailed process of creating remarkable visual presentations (That’s why we came up with the eBook), we will give you a quick primer on how to capture relationship between objects.
Step 1:
Start with the information on your bulleted slides. Remove the unnecessary words in each of the bulleted sentences. This will help you find the keywords of your message.
For example:
If your bullet point is:
- Most people have a strange habit when it comes to reading on the net. They don’t follow any specific order in reading the pages. They read in a random order.
Keywords are:
- Most people have a strange habit when it comes to reading web pages on the net. They don’t follow any specific order in reading the pages. They read in a random order.
Gist: People read web pages in random order.
Once you are clear with the keywords, the next step is to capture the relationship between the keywords. This will help you create the right diagram to represent the relationship.
Here is an example of how to capture the relationship between the keywords:

There is an effective method to capture the relations to help you come up with insightful visuals. We teach you the 3 critical steps for visualization in presentations in the eBook.
You can also read about a rough and ready way to quickly identify the right relationship between objects using the 4 common types of relationships for a shortcut to diagrams.
To summarize the article on visualization in presentations:
- Visualization is the art of capturing relationship between objects
- Since our mind stores information as connections, visual diagrams help your audience to ‘get’ your message fast and retain it longer
- To visualize information, start with bulleted sentences and remove the junk words to identify the keywords
- Once you identify the keywords, capture the relationship between keywords in the form of a diagram
Return to Top of Visualization in presentations Page
Read related article on Visual Chunking for effective PowerPoint Design
Return to Main PowerPoint Slides
