Back to Back Issues Page [Dec #1 Issue] Creative Ways to Represent Fishbone & V Diagrams
December 07, 2011Hi,
This week on Presentation Process, we are focused on more charts and diagrams. How to make charts easily and ideas to make them creative.
This will be of help when you start preparing your communication for showcasing your performance this year and drawing up your plans for the next year. More visual diagrams will make your content easy to understand and more creative ones will make it memorable!
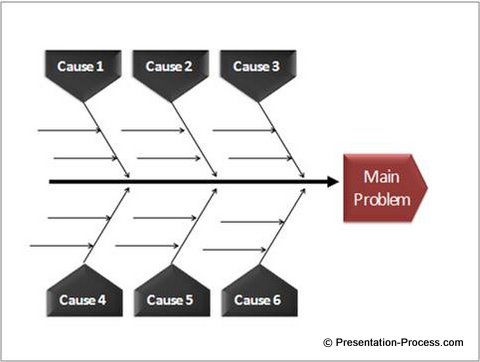
[Creative ideas] Create PowerPoint Fishbone in 1 Minute
 Fishbone chart is a key tool for root cause analysis. Create PowerPoint Fishbone diagram in 1 minute or less for your project presentations.
Follow our simple step by step instruction.
[PowerPoint Tutorial] Play with Shapes
 Unique shapes are useful to convey concepts. The more shapes you have at your disposal, the easier it gets to convey your ideas accurately and quickly. In this simple tutorial, you will learn how to play with Shapes in PowerPoint to create your custom diagram easily.
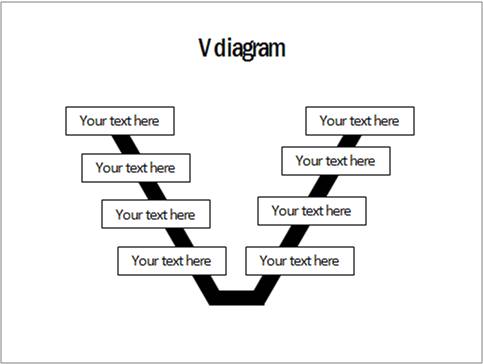
[Creative Ideas] Ideas for Creating V Diagram
 Discover a simple way to draw V Shaped diagram. Get inspired to create a number of variations based on the examples showcased in the article.
[Series] Selecting the right Chart based on 8 Relationships
Most relationships between objects can be categorized into one of the 8 common types.
Part 1 of the article series explored:
- Hierarchy
- Cause and effect
- Flow
- Part – wholePart 2 explores these PowerPoint charts
- Compare and Contrast
- Filters and funnels
- Matrix and
- List
| PowerPoint Charts & Diagrams Comprehensive pack of 750+ editable PowerPoint Diagrams. Instant Download! PowerPoint-Charts-CEO-Pack |
For feedback and suggestions, please do contact me.and I will reply as quickly as possible.
Happy Presenting!

Twitter: @Metamorphtrg
Facebook: PresentationProcess
