Home >All PowerPoint Tutorials> PowerPoint Animation> PowerPoint Scales
Learn to create useful 3D scales in PowerPoint for your business presentations. Watch and learn from this video tutorial.

Uses of 3D scales
In a business presentation you may need to compare options to help your audience make a decision. A 3D scale comes in handy to visually represent the pros and cons of the alternatives.
You can tell a story about the factors that influence a decision by animating the scales in stages. The diagram helps your audience grasp your concept quickly and remember your message for a long time.
Take a look at some of the useful templates we created using the method you are about to learn. These templates are all part of our 750+ PowerPoint Charts & Diagrams Pack. The pack has 750+ unique high quality animated PowerPoint diagrams to make your slides look more professional instantly.
1. Comparing performance PowerPoint Template:
This elegant template helps you compare the performance of two options. The column charts placed on the two sides are useful in finance presentations.

Source: Pros and Cons From PowerPoint Charts CEO Pack
2.Positives versus Negatives PowerPoint Template:
This template helps you talk about the Positive points and Negative points separately. This helps your audience evaluate your argument objectively.

3.Simple visual diagram template to represent ‘For’ and ‘Against’:
Sometimes you may need a more direct way to showcase points that go ‘For’ and ‘Against’ your argument. In such cases a simple diagram like the one below may suffice:

Source: Pros and Cons | CEO Pack
No matter what method you use to make comparisons, knowing how to create 3D PowerPoint scales will help you communicate your message effectively.
Watch the following video to understand the method to create the animated scales in a step by step way:
The video starts with a 3D platform which is already created. See Tutorial to create 3D PowerPoint Platform here >>
Click PLAY to view tutorial
Related: See how to use Spin Animation creatively
Conclusion:
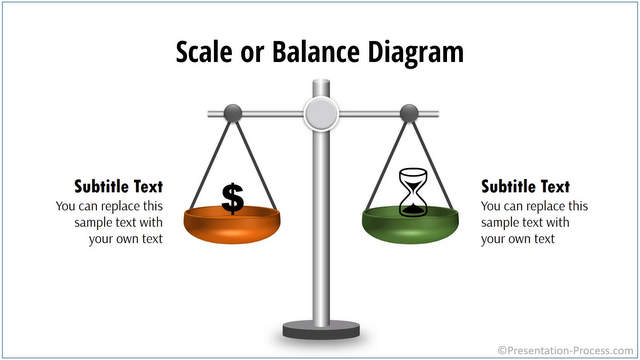
You can create your own variations of the scales and place different objects on them. Make sure that the animation is subtle and smooth.
If you are too busy to experiment, you can always take a look at more scales from PowerPoint Charts Pack for CEOs (Volume 1).
Source: Balance Diagrams | CEO Pack


In today’s competitive market, you need all the support you can muster to communicate your message effectively. Using a good template not only makes a professional impression on your audience, but also frees up your time to focus on your business.
Related: Tutorial to create a PowerPoint Balance
