Home > Presentation Ideas > Presentation Graphics > Creative PowerPoint Process Ideas
Discover 5 creative ways to make your Process flows interesting in PowerPoint. It need no longer be text based or boring, no matter how complex it is.
The problem with PowerPoint Process Flows:
We have all at one time or the other seen flowcharts like this – created with small fonts that are impossible for the audience to read.

They also look so complex, that audience may just give up trying to understand what it is supposed to explain. It is tough for the presenter as well, as they need to represent a lot of data in 1 slide.
So how do show all that you need to show, without turning off your audience? Here are 5 ways in which you can make it easier for your audience to understand such flowcharts in PowerPoint without losing the presentation flow.
Idea 1: Use Transition for Seamless Flow
Break up the flow chart over multiple slides and use Push left transition between slides to make it look like one seamless flow. Set this up by selecting the process slides and then going to Animations> transitions to this slide > Push Left Animation.

This transition set up makes it look like one very long slide rather than multiple slides with different parts of the process. This simple technique allows you to display large and complex processes in a slide without using small font sizes,
If you want to, you can print the flowchart out and provide it to your audience as well so they can actually read it.
Related: Tips on making Presentations Flow
Idea 2: Group and Break Up
If your process can be broken up into groups, then group the items of the flow chart and first show an overall flow. You can then show details of each part of the flow.
For example, the set process for sales call by a company person to the retail distributor can be broken up into 3 parts.

Once this is clear and explained each of the steps can be delved into and explored in detail like this:

Related: Great examples of Visual Chunking
Idea 3: Use professional icons to represent your points
If each step of the process is really important, it helps to illustrate each step with a small professional icon. This is used especially when the process is not too long and complex. Adding icons when the slide is already full just serves to clutter up the space.
![]()
Can you see how adding the icons made the PowerPoint process stand out from the usual slides?
Related: Create Expressive Icons in PowerPoint
Idea 4: Use analogy to represent the process
Use a metaphor or analogy to make the slide interesting and the concept easy to remember.
Here is a simple example of 5 steps of brand activation. While the same thing could be represented as bullet points, this is far easier for the audience to recall.

[su_spacer]
[su_spacer]
Idea 5: Use Animations to show actual events
This is the best possible alternative, especially if the process is a critical part of your presentation. By using custom animations, you are going beyond just visuals. You are actually creating an experience for your audience. The animation need not be complex, simple entrance and fade animations can represent your processes easily.
Here for example is the 3 step process by which you can deal with emails effectively
Managing Email Effectively: Sort Categorize Act

More Creative Variations and options for PowerPoint Process:
Here are examples from our 750+ charts and diagrams pack of different creative ideas. You can visualize and create these ideas yourself or get the ready to use pack and save the time and effort.
Here are some examples from the PowerPoint Process Section of the CEO Pack:
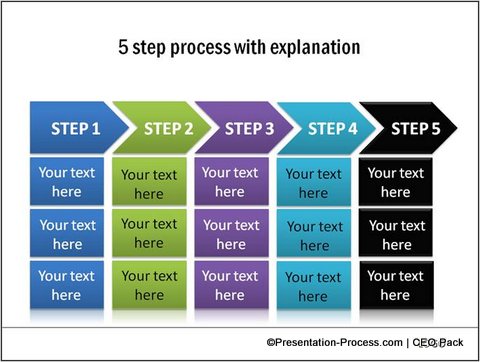
Example: Categorize the process into different parts using color themes:

Example: Use professional icons to represent stages of the process

Example: Pipeline as Analogy for a process flow

Example: Make it visual with a target or steps to show the process

Source: Powerpoint Target diagrams from CEO Pack
Example: make a cyclic flow visual with a PowerPoint circle

Source: PowerPoint Circular Flows from CEO Pack
Example: Use animations to represent the ideas.
In this case, the idea of input—processing-output is shown with animation. The changing colors of the glossy globes indicate the change after the process.
Input Throughput Output Concept

As you can see there are many ideas you can implement if you just think and present any process more creatively. Look around this section to find many more creative ideas.
Related: Creative Timeline Ideas
Return to Top of Creative PowerPoint Process Ideas Page
