Home > All Tutorials > PowerPoint Graphics> PowerPoint Pillar
Learn to draw pillar diagram in PowerPoint in 3 easy steps. Include this useful temple diagram in your strategy and consulting presentations.
The simple pillar you will learn to create today is:

Where is Pillar diagram used?
Roman pillars are typically used as a metaphor for support structures.
The diagram is useful for representing underlying principles of a concept or organizational values that support your strategic vision etc.The diagram is also called as pantheon diagram or temple chart.
Let us learn to create this useful diagram step by step:
New: Tutorial Video on Steps to create Pillar Diagram
Article on Steps to create Pillar Diagram
Step 1: Creating the pillars
Use rectangle tool from auto shapes menu and draw 4 rectangular blocks as follows:

Select all the four rectangles and Arrange -> Align top and Arrange -> Distribute horizontally.Once done, group them together using ‘Ctrl+G’ option.
Related: Creative Ways to represent Strategic Diagrams
Step 2: Creating the base
Draw a thin horizontal rectangular block as the base below the pillars. Copy the base and paste it on the top to support the structure above. The result will be as follows:

Step 3: Completing the diagram
Draw a thicker rectangle below the base to serve as a platform for the temple. Draw a triangle above the structure to complete the diagram.

Select all the shapes and go to Arrange -> ‘Align center’ and ‘distribute vertically’. Your pillar diagram is ready:
Variations of the temple chart:
You may choose to add more steps to the temple or show segmented pillars as follows depending on the concept you want to convey:

You can vary the number of pillars depending on your specific need:

As you can see, you can make variations to the diagram in a matter of minutes.
Related: Simple Filter Diagram Tutorial
Making these Pillar Diagrams Professional
If you want to use professional looking Pillar charts for your critical business presentations, we recommend you take a look at our PowerPoint charts & diagrams pack. Here are some samples from the pack:


Source: PowerPoint Pillars from Charts & Diagrams CEO Pack
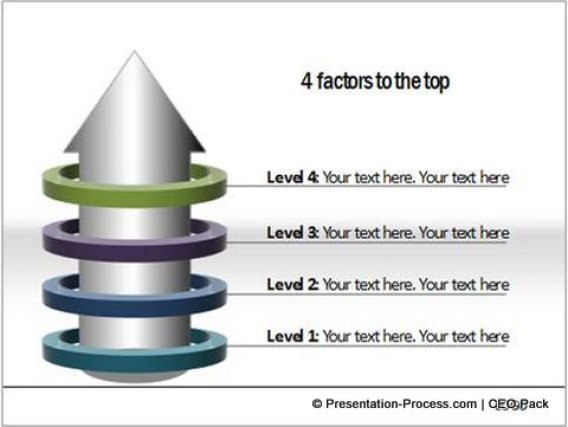
Here are some creative variations that help you explain your ideas more accurately:

Another creative variation from the CEO Pack, to help you express your business ideas :

Know More about PowerPoint Charts & Diagrams CEO Pack
Recommendation:
There are tons of useful diagram tutorials in this site that help you enhance your slide design. Please go through them if you’d like to improve your PowerPoint skills.
Related: See Animations Tutorials for PowerPoint
