Part of : 320+ Visual PowerPoint Graphs Pack
Widest Variety of Data-Driven Graphs & Infographics for PowerPoint
Line Chart with 3 Period Moving Average

Description: Line Charts can show far more details and insights than what appears at a glance in PowerPoint. This section showcases how a simple line chart template for PowerPoint can show projections, trends, 3-Period moving averages, forecasts and more.
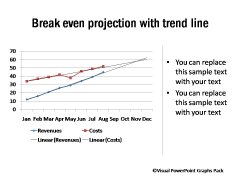
Chart with Breakeven Projection
Line Graph with highlight of one series
Chart with Markers
| Graph with Detailed Explanations
Graph with only Last Values Displayed
3D Line Chart
|
Performance Forecast and Linear Trend Line


