Home > PowerPoint Tutorials > PowerPoint Circle Diagram
Discover a shortcut to draw circle diagram with segments in PowerPoint. Save time and get a professional looking diagram with this surprisingly simple method.
The PowerPoint circle diagram you’ll learn is:

Isn’t the diagram beautiful? What if I say, it took less than 60 seconds to create this diagram? Surprised? Read on…
The usual way of drawing circle diagrams is messy:
The usual way of drawing a circle diagram with segments is to use ‘Pie’ tool from Auto shapes menu.

Here is the typical result of using the Pie Shape in PowerPoint:

The method not only gives you messy results, but also makes it difficult to create variations fast. The reason is – you don’t have an easy way to measure the angle of the segments you create. So, you need to keep experimenting till the various pieces fit together properly. That takes a lot of time and effort (and calculations too!).
Today, we will create the diagram using PowerPoint chart function instead of the usual auto shapes tool. The method gives you complete flexibility to create the diagram with any number of segments you desire.
Video Tutorial on Creating Segmented Diagram with Pie Chart
Article on Creating Segmented Diagram
Step 1: Insert a Pie chart
Open a slide. Go to Insert -> Chart ->Pie and select the first option

You will get the following result using the in-built data that PowerPoint uses:

Delete the legend and chart title. Go to Design Option in the Menu Bar and select the look and feel of the chart.

Our base pie chart is ready. But, the segments of the circle are not uniform yet.

Step 2: Edit data in the accompanying worksheet
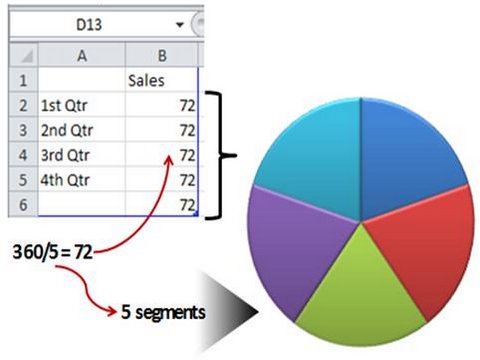
We want to create a circle diagram with 5 uniform segments. So, right click on the pie chart and go to ‘Edit Data’ option.
Since the total angle in a circle is 360°, we will divide this by 5 to get our 5 segments. So, we enter a value of 72° for each of the 5 segments. Remember to drag the ‘blue selection’ to cover all the 5 data points as follows:

Voila! We got our circle diagram with 5 segments.
Related: Tutorial to create Designer PowerPoint Pie Chart
Step 3: Giving the finishing touches
You can enter your text in each of the segments. Add gloss at the top edge and a shadow at the bottom. The result is a beautiful PowerPoint circle diagram:

You can create the diagram with as many segments as you want. You just need to divide 360° by the number of segments you need. When you enter the data in the accompanying worksheet, make sure that you drag the blue selection to accommodate the data you entered.
Related: Create Glossy Effect in PowerPoint
Inspiration for more circle diagrams:
We wish to show you some interesting circle diagrams from our ‘750 + PowerPoint Charts and Diagram templates collection for CEOs’. We made these diagrams with auto shapes tool, to allow you the flexibility of applying custom animation and 3D Bevel.
Circular Segments Diagrams Variations


Source: PowerPoint Charts & Diagrams CEO Pack
PowerPoint 3D Diagrams: Wheels

5 Step Circular Chevrons | 3D Circular Arrow


See More PowerPoint Circles from CEO Pack >>
All the 750 diagram templates from our CEO pack are fully editable. You can change every element of the diagrams to suit your specific need. You can pick elements from different diagrams to create your own diagram templates.
Just copy our diagrams to your slides and replace the sample text with your own text. Your professional presentation gets ready in minutes.
If you are a business presenter, you can save time and get professional results by using our diagrams pack, instead of creating the diagrams from the scratch. Take a couple of minutes to browse through our collection. See the possibilities open up in front of your eyes.
I hope you enjoyed this article on PowerPoint Circle Diagram. You can find many more creative ideas and tutorials at Presentation Process. Here are some…
Related: PowerPoint Wheel Diagram Tutorial
Related Tutorial Creative 3D Circle in PowerPoint
Return to Top of PowerPoint Circle Diagram Page
