Part of : 320+ Visual PowerPoint Graphs Pack
Widest Variety of Data-Driven Graphs & Infographics for PowerPoint
Pareto Graph Showing Cumulative Percent & Benchmark

Description: This section has pareto charts, cumulative frequency, histogram and variations of the same. These are useful in analyzing components of sales, service levels etc.
Pareto Analysis with Line & Stylized Markers
 Values Adding up to 80 Percentage
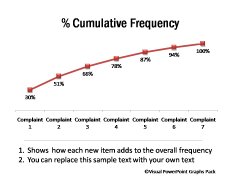
|  Percentage Cumulative Frequency Chart
|
Cumulative Frequency Variation

Histogram Charts showing Frequency distribution
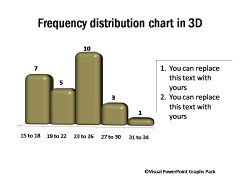
| 3D Frequency Distribution
|
Histogram with Cumulative Frequency

Tornado Chart


