Part of Hand Drawn Pack
300+ Editable Hand Drawn Graphics Templates for PowerPoint
This pack over 300+ editable PowerPoint Graphics including Agenda, Pros and cons, Bulleted and Numbered Lists, Timelines, Roadmaps , Linear Processes , Circular Processes, consulting models, business concepts and more…

Linear Process Templates
Hand drawn Style Downward Process Flow Diagram

Graphics showing simple and continuous process flows
 |  |
Process Chart showing Stage-wise Progression

Four Steps of a Connected Process
 |  |
Four Steps of a Connected Process

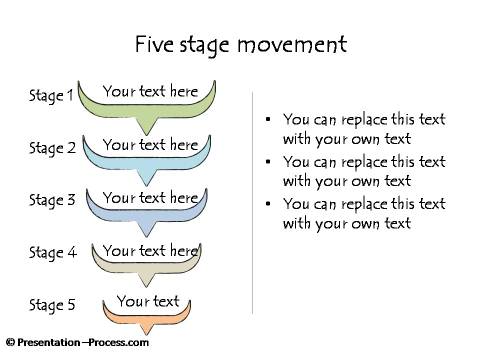
Five Stage Movement

Next Steps | Levels of Process
 |  |
Interesting 5 Step Process Diagram

Interesting 5 Step Process Diagram with 1 step highlighted
 |  |
Animated Diagram highlighting one point at a time

Reverse Steps | Linked Steps of a Process
 |  |
Hand Drawn Graphics: Circular Processes
Curved Flow Diagram

Straight vs circular flow | Forward Momentum
 |  |
Complex Work Flow | 2 Different Process leading to one result
 |  |
Circular Flow Process Chart

Circular Arrows | Six Step Circle
 |  |
Basic Looped Process Template

Turning Point in a cycle

Hand Drawn Cycle Diagram
 |  |
Circular Diagram Sketch

Circular Reference | 4 Looped Steps
 |  |
Outcomes of a Process Flow

6 Step Cycles
 |  |
Sketch style Circular Arrow Diagram

Arrows Showing Cycle | Interconnected Process
 |  |
One Key Point Highlighted in a Flow | In and Out Flows
 |  |
Sketch Style Graphics: Interconnected Processes

Outflows | Cyclical Flows
 |  |
Circling or Turning Flows

Reinforcing Loops | 2 Interconnecting Loops
 |  |
Positive and Negative Loops Interlinked

| Related Sections |
About Process Flows:
These are a type of flowcharts showing events in a box and direction of flows are represented with arrows. These could be data flows, work flows, customer interaction process, sales processes, simple manufacturing or engineering process or any other flows or steps.
These diagrams help visualize and understand the flows. Each step then can be evaluated for bottlenecks, problems and issues. Each step of the process can also be broken down and studied more in detail.
This section contains both linear and circular flow diagrams. Linear processes are those where one step follows the other and has a single outcome. The steps are sequential. An example is flow of goods from factory to a consumer.
The editable diagrams in this pack can be used to represent simple linear flows. You can add or remove elements in the steps by copying or deleting the editable boxes.
The other type of process flows are Circular. These are looped processes or cyclic processes that work with repetition. For example macroeconomic activity can be represented as a cycle.
The hand drawn pack provides a range of options to represent flows including loops, partial loops, curved, cyclic, step wise, reverse flows and more.
About Hand Drawn Pack:
Editable hand drawn graphics, handwritten, pictographs, graphics, scribble, sketch effect diagrams to make your presentations look different and interesting quickly.


