Home PowerPoint Diagram Diagram in PowerPoint
There is just one fundamental principle you need to learn, to draw an effective diagram in PowerPoint. The principle is so important that it is worth highlighting and putting it in a box. Here is the golden principle:
We know that bounced right off your head. Don’t worry.
You’ll understand the principle easily with this …
Simple example of creating a diagram…
Let’s begin with a question:
How do you make an earthen pot?

“Take some clay. Add some water. Mould it into the shape of a pot.”
Now, let’s remove all the unnecessary words from the above and take just the keywords to make the sentence. Here is the result…

OK. Let us do an action replay frame by frame to understand what you did just now:
First, you read the sentence: Take some clay. Add some water. Mould it into the shape of a pot.
Then, you mentally identified the key components of the sentence:
Take some clay. Add some water. Mould it into the shape of a pot.
Then, you wrote it as follows:

“Take some clay. Add some water. Mould it into the shape of a pot.”
They can be classified as components (highlighted in red) and the action between the components (highlighted in green).
We call these components as Objects and the action between the components as Relationship.
If you just capture this simple skeletal frame on a piece of paper or a flipchart, and explain it with words, your communication will be much clearer than just saying the words.
You can take it to the next level by…
Visualizing the objects:
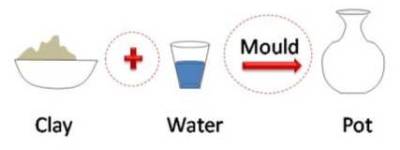
All we are going to do now is to put a rough image to represent the words in the example above. Here is the result:

To quickly review what we mentioned just a while back:


To conclude…
No matter how grand or complex your idea is, the underlying principle to represent it in diagrams, remains the same. But, the challenge is in identifying the objects correctly, and finding ways to represent the relationships accurately.
This is just a small part of learning to create diagrams. If you would like to learn more, with business examples of before and after scenarios…
Get Your copy of Visual Presentations eBook

Mode:Download on purchase
Format: Adobe PDF
File Size:5 MB
Print Length:104 pages
Pay safely using your Paypal account or Credit Card and download the file.
Price: US$ 12

Note: Your billing statement will show a charge from PAYPAL*PRESENT
Once your purchase is processed successfully, you will receive an email with the link from which you can download the “Visual Presentations” eBook right away.
Understand the 3 steps to create a PowerPoint diagram.
Return to Top of Create Diagram in PowerPoint Page
Return to Main PowerPoint Diagram Page
