Home > Creative Ideas > Presentation Graphics > Decision Tree Diagram in PowerPoint
Learn to create a simple decision tree diagram using PowerPoint. Find examples of interesting variations of the chart for your business presentations.
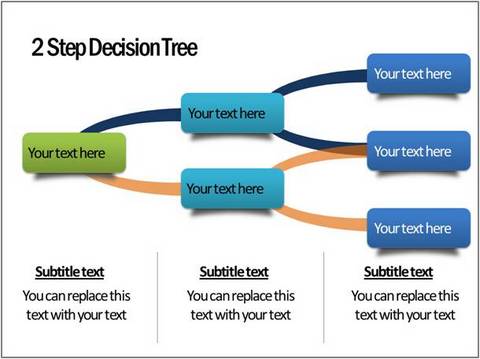
Here is a sample Decision Tree Diagram in PowerPoint:
 The diagram may not be ‘pretty’, but it is quite useful to make a persuasive argument in a business situation. Typical situations where you might use the diagram are:
- Whether to go with a purchase option or lease option when you need a heavy machinery for production
- Whether to bid on a new project or not
- Whether to enter a new market segment or not etc.
The simple organization of ‘decisions and outcomes’ make it easy for the audience to understand the argument. You can even use the diagram to conduct an elaborate ‘If –then’ analysis with your team.
The diagram is quite easy to create in PowerPoint once you understand the components. Here is a quick rundown of the components of a decision tree chart.
Understanding the nodes and lines
There are three types of nodes used in a decision tree chart. They are:
- Decision nodes – represented by squares
- Chance nodes – represented by circles
- End nodes – represented by triangles at the end of lines
Chance nodes have uncertain outcomes. So, they are usually accompanied by guesses regarding probability of occurrence. We distinguish the nodes by different colors to make it easy for people to recognize the types.
The outcomes are represented by lines. The nodes and lines provide different paths for the audience to visualize outcomes. Usually decision trees are much easier for the audience to understand than flowcharts which have numerous symbols.
You may like: Ladder diagram tutorial in PowerPoint
Why create decision tree diagram in PowerPoint?
The single biggest reason to create the chart in PowerPoint is – you can use the power of custom animation to progressively reveal the outcomes at each stage.
The other reasons are:
- You can use ‘Push’ transitions to show fairly large trees in a seamless way (refer to our article on using ‘Push transitions’ to know more)
- You can zoom in on certain portions of the tree to create alternative options
- You can copy, paste and edit slides to create multiple scenarios
All you need to know is to pick and stick elements from auto shapes options to slides. The rest is fairly intuitive.
Here are some readymade decision tree diagrams that add a sparkle to your slides. They are part of our ‘PowerPoint Charts Templates Packs for CEOs’.


Source: Tree Diagrams from CEO Pack 1

Source: Hierarchy Charts from PowerPoint Graphics CEO Pack 2
A quick word about our CEO Packs:
Professional quality business graphics are not easy to create. They demand a lot of time and effort from you. If you are too busy to invest the time needed to build your diagrams from scratch, we recommend you take a look at our ‘PowerPoint 2 CEO Packs Bundle’.
The Bundle has more than 1600 premium charts, diagrams, graphs and graphics to help you visualize every business idea imaginable. Just choose the template that matches your thought and replace the sample text with your own text. Your business slides get ready in no time. Creating professional presentations has never been easier.
Why waste time creating your graphics and diagrams from scratch, when you have such high quality solutions available off the shelf? Please browse through our diagrams collection and see how the CEO packs can change the way you create your business presentations forever.
Related: Variations of BCG Matrix Template

