Home > PowerPoint Tutorials > Special Effects > 3D bevel in PowerPoint
Discover the power of simple 3D bevel effect in PowerPoint. Add flourish to your business diagrams by applying this useful technique.
Why use 3D bevel in PowerPoint?
Sometimes when you create simple diagrams and frameworks for your business presentations – your graphics may look dull and boring. For example, take a look at the following diagram:
 When you apply a bevel, your diagram comes to life. Here is an altered version of the diagram you saw above:
 In this article, you will learn to create some interesting bevels and find some practical application of the technique.
How to apply 3D bevels to your graphics?
Right click on the shape you want to apply 3D bevel to. Go to Format shape -> 3D Format -> Bevel. You can apply bevel to ‘Top’ or ‘Bottom’ of the shape. Here we applied default 3D bevel to ‘Top’ of the shape.
 The default bevels may not always suit your need:
The default options for bevels don’t always give you the kind of result you want when you apply them on a flat object. You may need to increase the Width and Height of the bevels as shown here:
 The width and height of the default bevel for ‘Convex’ option is 6 pts each. You can hardly notice the bevel applied.
When you click on the shape, go to Format Shape and increase the width to 12 pt and height to 7 pt you begin to see the difference.
 Try using different combination of width and height for the 3D bevel in PowerPoint to see what suits you better.
Related: Create a stunning 3D PowerPoint Target
Try different bevel types:
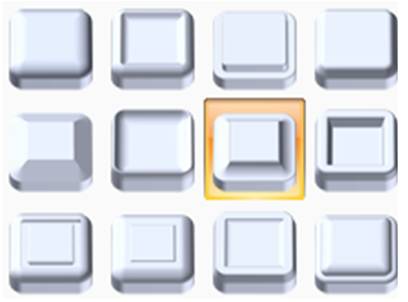
PowerPoint provides you 12 different options for bevels.
 Not all of them look good on flat objects. Try different options with different settings to find the combination that suits you the best. Here are some examples for your consideration:
 Related: 3D Background effects for your presentation
Application of the technique:
We wish to show you some examples from our ‘PowerPoint Charts and Diagram templates packs for CEOs’ that use 3D bevels. The packs have more than 1600 premium charts, diagrams, graphs and graphics to help you visualize every business idea imaginable.
The following diagram template uses ‘convex’ option:

Source: Relationship Models from PowerPoint CEO Pack 2
We applied sheen to the hexagon in the centre to make the diagram stand out.
The diagram you see below showcases different bevel types with different width and height combinations:
 Here is an example where we increased the height of the bevel to the point where the bevel becomes a part of the design:

Source: Relationship Models from PowerPoint CEO Pack 2
Here we show 3D bevel in PowerPoint applied with 3D rotation preset. The sheen on top of the diagram is created by the changes in ‘Material’ and ‘Lighting’ settings:
 Here is another example of combining 3D rotation, Perspective and Bevel to the grouped shapes:

Source: Relationship Models from PowerPoint CEO Pack 2
The variations are limited only by your imagination.
[su_spacer size=”20″]
[su_spacer size=”20″]
Related: Relationship diagrams using PowerPoint Arc Tool
Return to Main Special Effects in PowerPoint Page
